# Home page
# Monitor
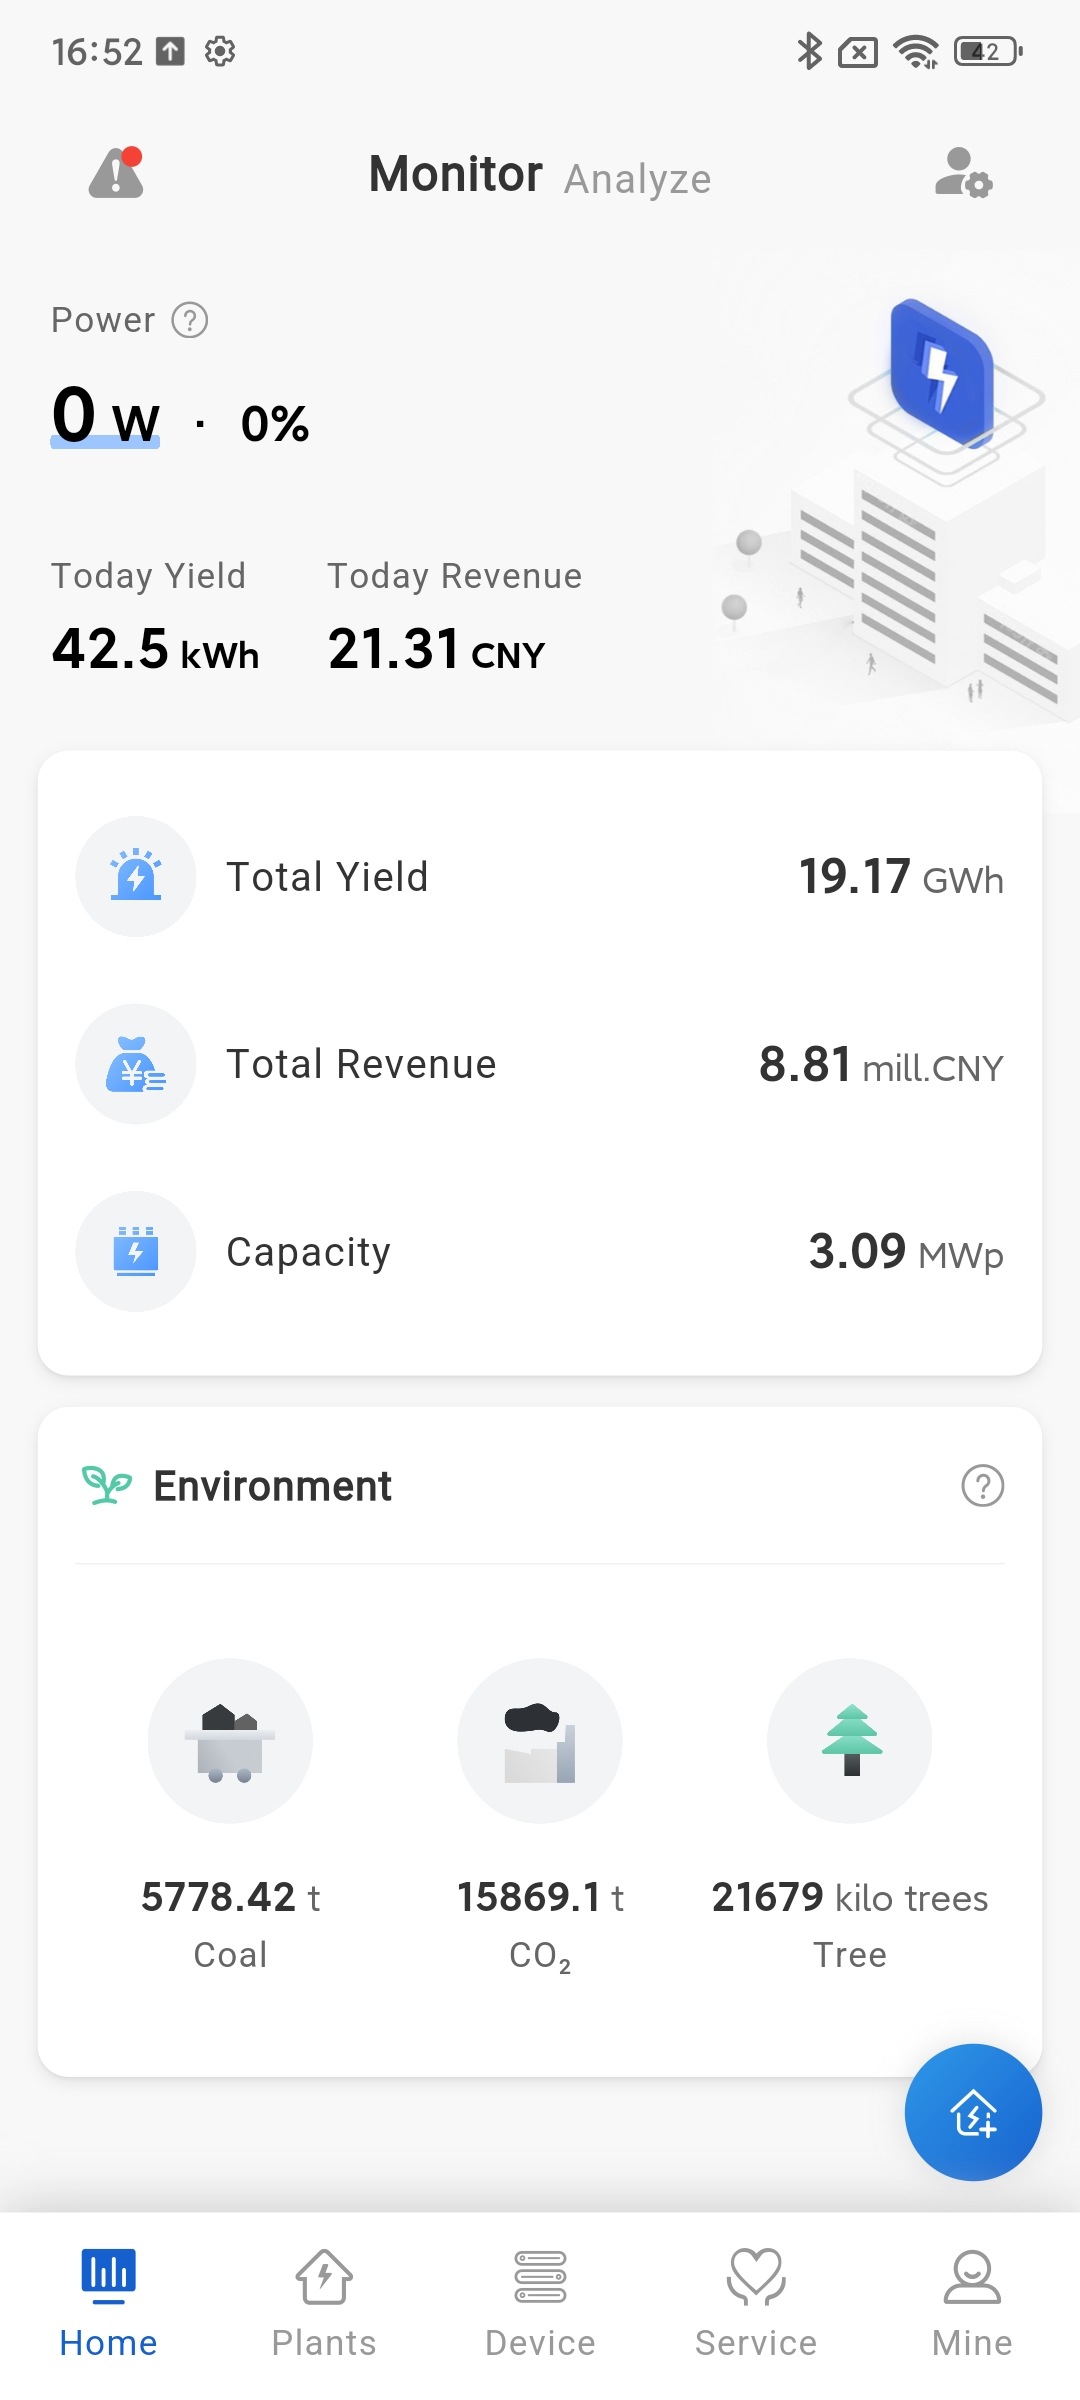
[Power]Display the latest total power generation of all Plants under your name at the current time.
[Power normalization]Display the normalized value of the current time power of the Plant under your name, calculated using the formula: current power/installed power.
[Toady Yield]Show the power generation status of all the Plants under your name today.
[Today Revenue]Show the current generation revenue of all Plants under your name. The calculation formula is: the electricity price set at the time of Plant creation multiplied by today's electricity generation.
[Total Yield]Show the total electricity generation of all the Plants under your name up to now.
[Total Revenue]Display the cumulative power generation revenue of all Plants under your name. The calculation formula is: the electricity price entered at the time of Plant creation multiplied by the cumulative power generation.
[Capacity]Show the sum of the rated power of all the Plants under your name.
[Coal]Display the coal saving situation of all Plants under your name, calculated by the formula: saving standard coal (ton)=0.0003015 * cumulative power generation (kWh).
[CO₂]Display the CO ₂ emission reduction of all Plants under your name, calculated using the formula: CO ₂ emission reduction (tons)=0.000828 * cumulative power generation (kWh).
[Tree]Display the equivalent tree planting situation of all Plants under your name, calculated using the formula: cumulative power generation (kWh) * 0.828/40/18.3.
# Analyze
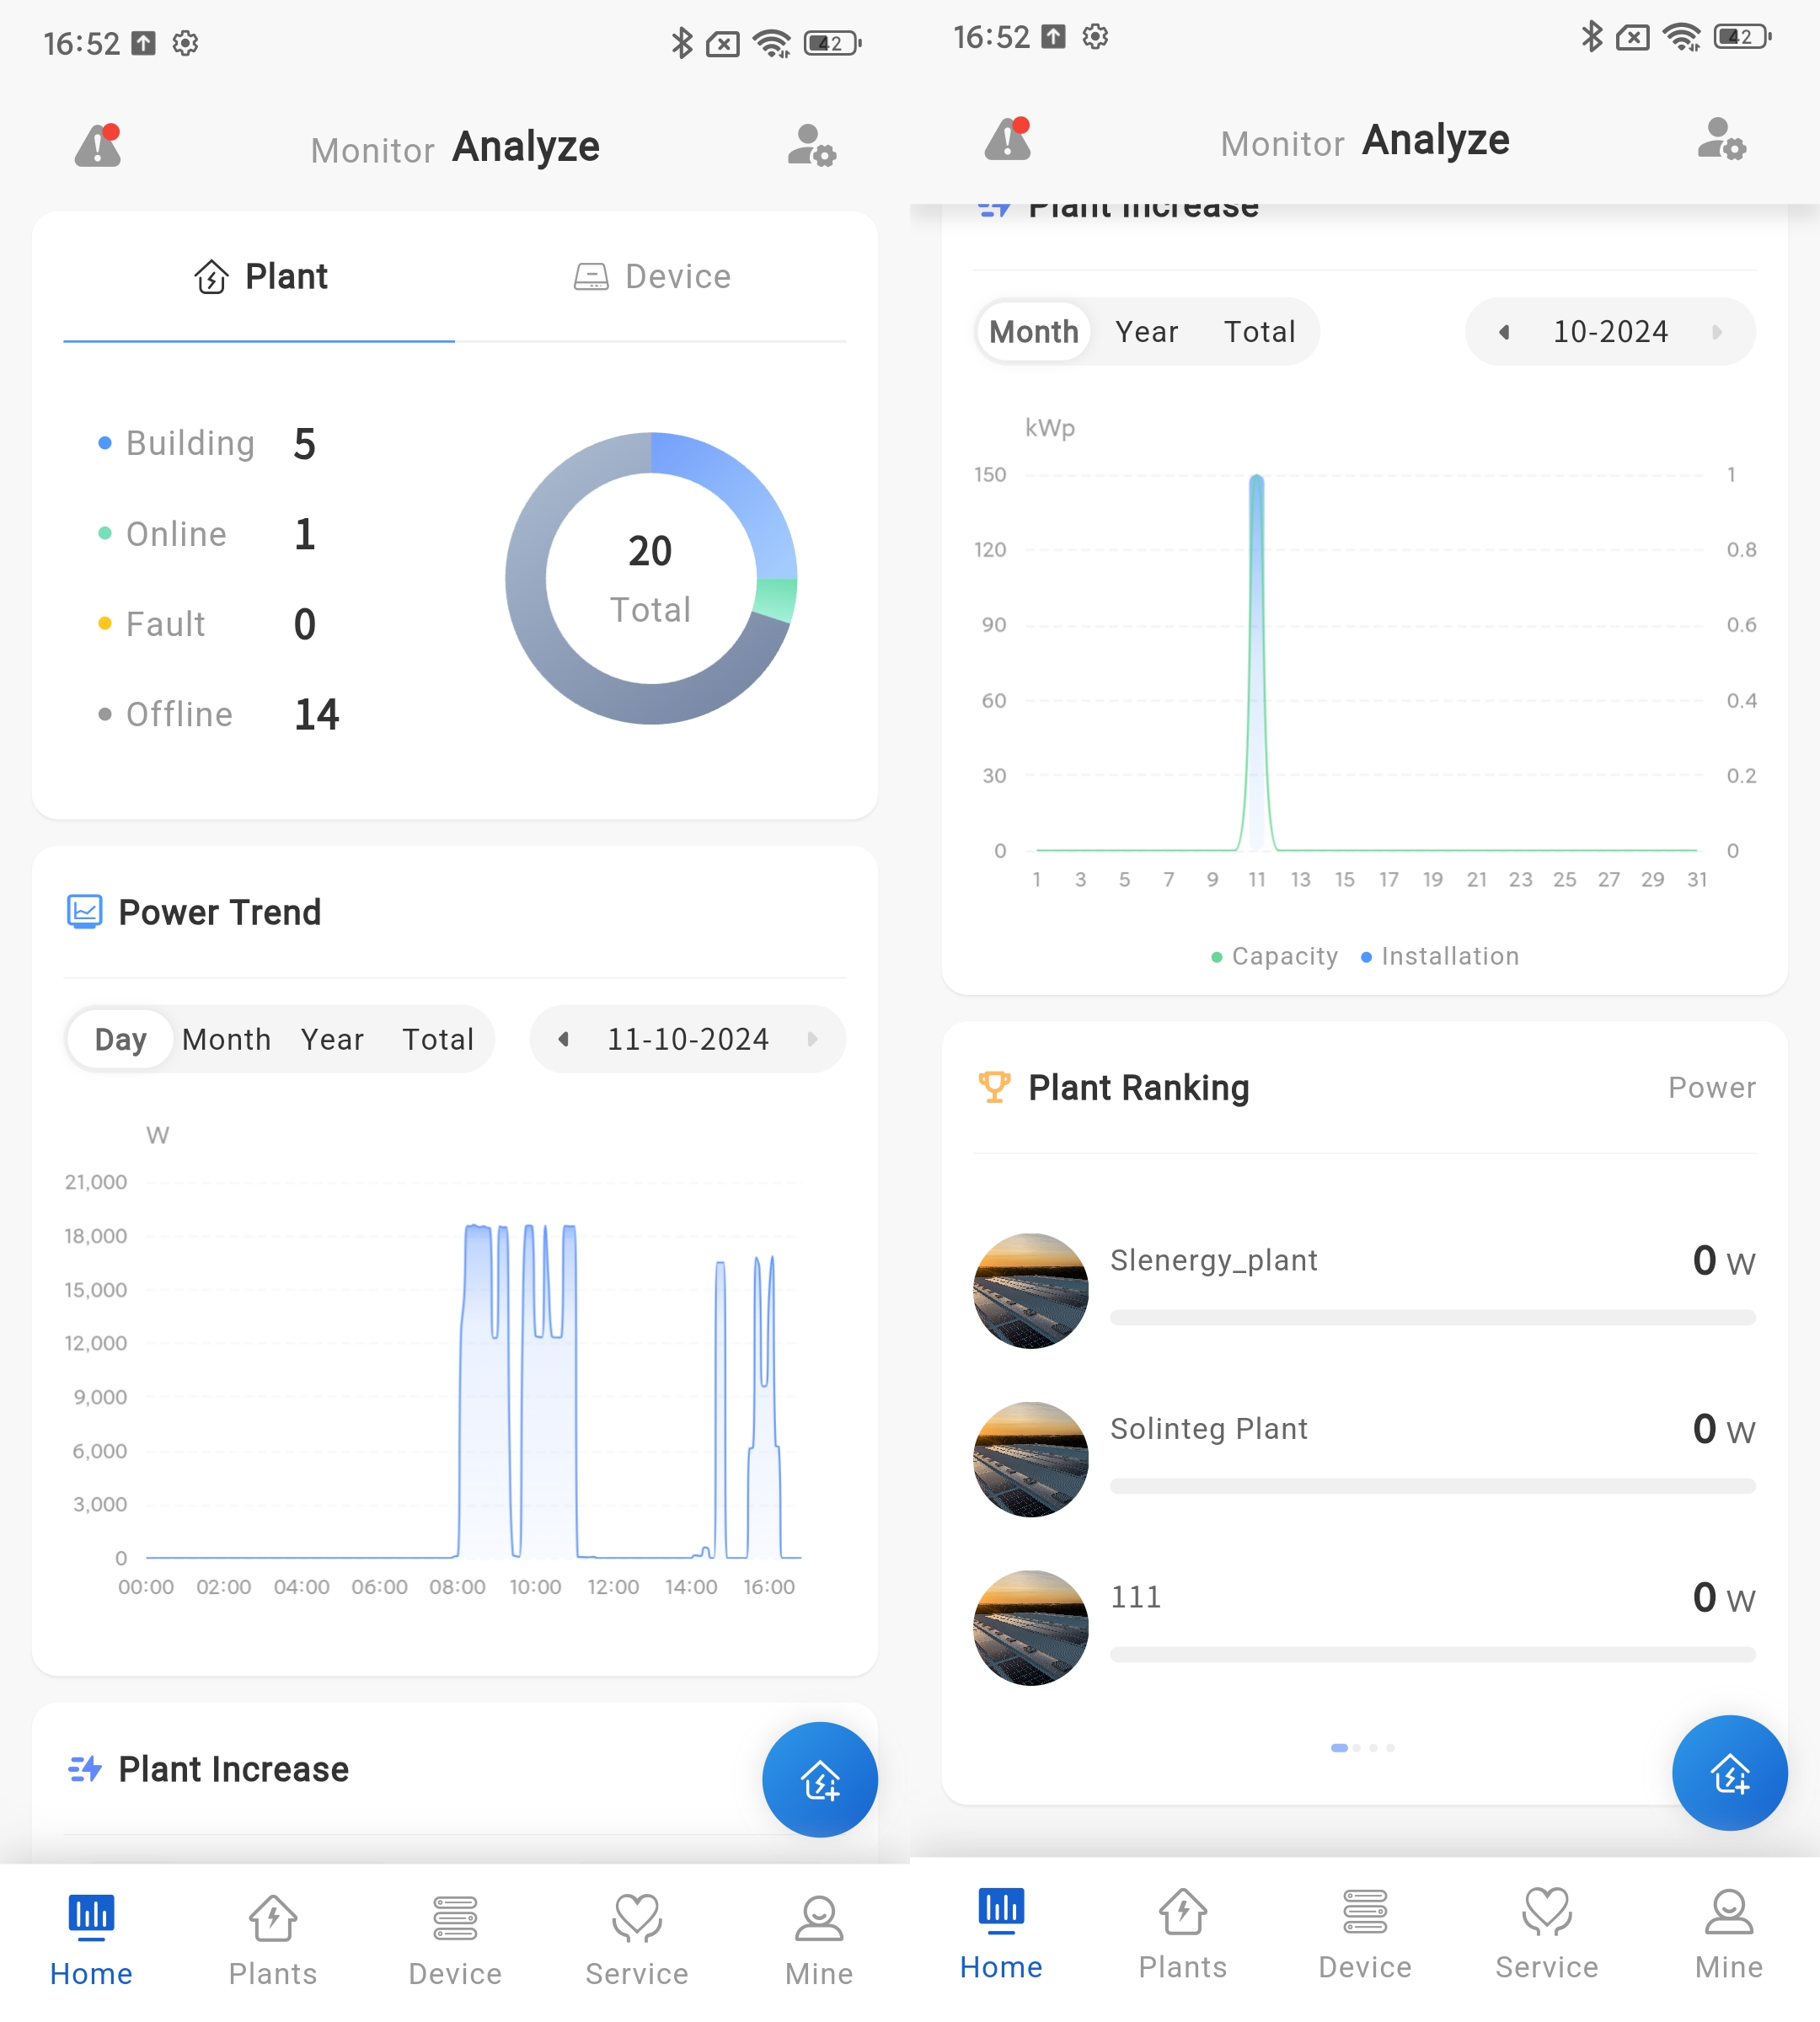
[Plant]The data status directly displays the status of all Plants associated with you. Click on the status in the statistics to jump to the status category in the Plant module.
[Device]The data status directly displays the equipment operation status of all Plants associated with you. Click on the device status in the statistical data to jump to the category of that status in the device module.
# Plant Trend
[Day]Show the power generation status of all the Plants under your name today. You can also click on the date box to select any day and view the power plant power data for that day.
[Month]Show the power generation of all the Plants under your name for this month. You can also click on the date box to select any month and view the power generation data for that month.
[year]Display the power generation of all the Plants under your name this year. You can also click on the date selection box to select any year and view the power generation data of that year's Plants.
[Total]Display the power generation status of all Plants under your name since their creation.
# Plant Increase
[Month]Display the number of newly established Plants in your company for the current month.
[year]Display the number of newly established Plants in your company's current year.
[Total]Display the statistics of the number of Plants established by your company since its creation in the system.
# Plant Ranking
[Equivalent]Display the equivalent hourly data of all Plants under your name. The calculation formula is: today's electricity generation/installed power.
[Today Yield]You can right-click on the Plant ranking data to switch to other statistical maintenance, select the "Today's Power Generation" option to view the ranking data of today's power generation for all your Plants.
[Total Yield]You can right-click on the Plant ranking data to switch to other statistical maintenance, select the cumulative power generation option to view the ranking data of the cumulative power generation of all your Plants.
[Power]You can right-click on the Plant ranking data to switch to other statistical maintenance, select the current power option to view the ranking data of all your Plants' current power.
# Fault information
Click the  button on the homepage to view all equipment fault data associated with your Plant (default display shows ongoing faults).
- View fault details
① Log in to the Smart M app.
② Click the button on the homepage.
③ Click on any fault data. Detailed data of the fault pops up at the bottom of the page.
- fault Analysis
① Log in to the Smart M app.
② Click the button on the homepage.
③ Click on any fault data. Detailed data of the fault pops up at the bottom of the page.
④ Click on the analysis tab on the pop-up page. You can view the working condition of the equipment during the fault time. The system supports viewing the working status of multi-dimensional equipment, and maintenance personnel can analyze the cause of faults based on the specific operating status of the equipment.
# User Manage
Power normalization: Click the [icon] button in the upper right corner of the homepage to quickly enter the user management page. For specific user management steps, please refer to:User Manage。
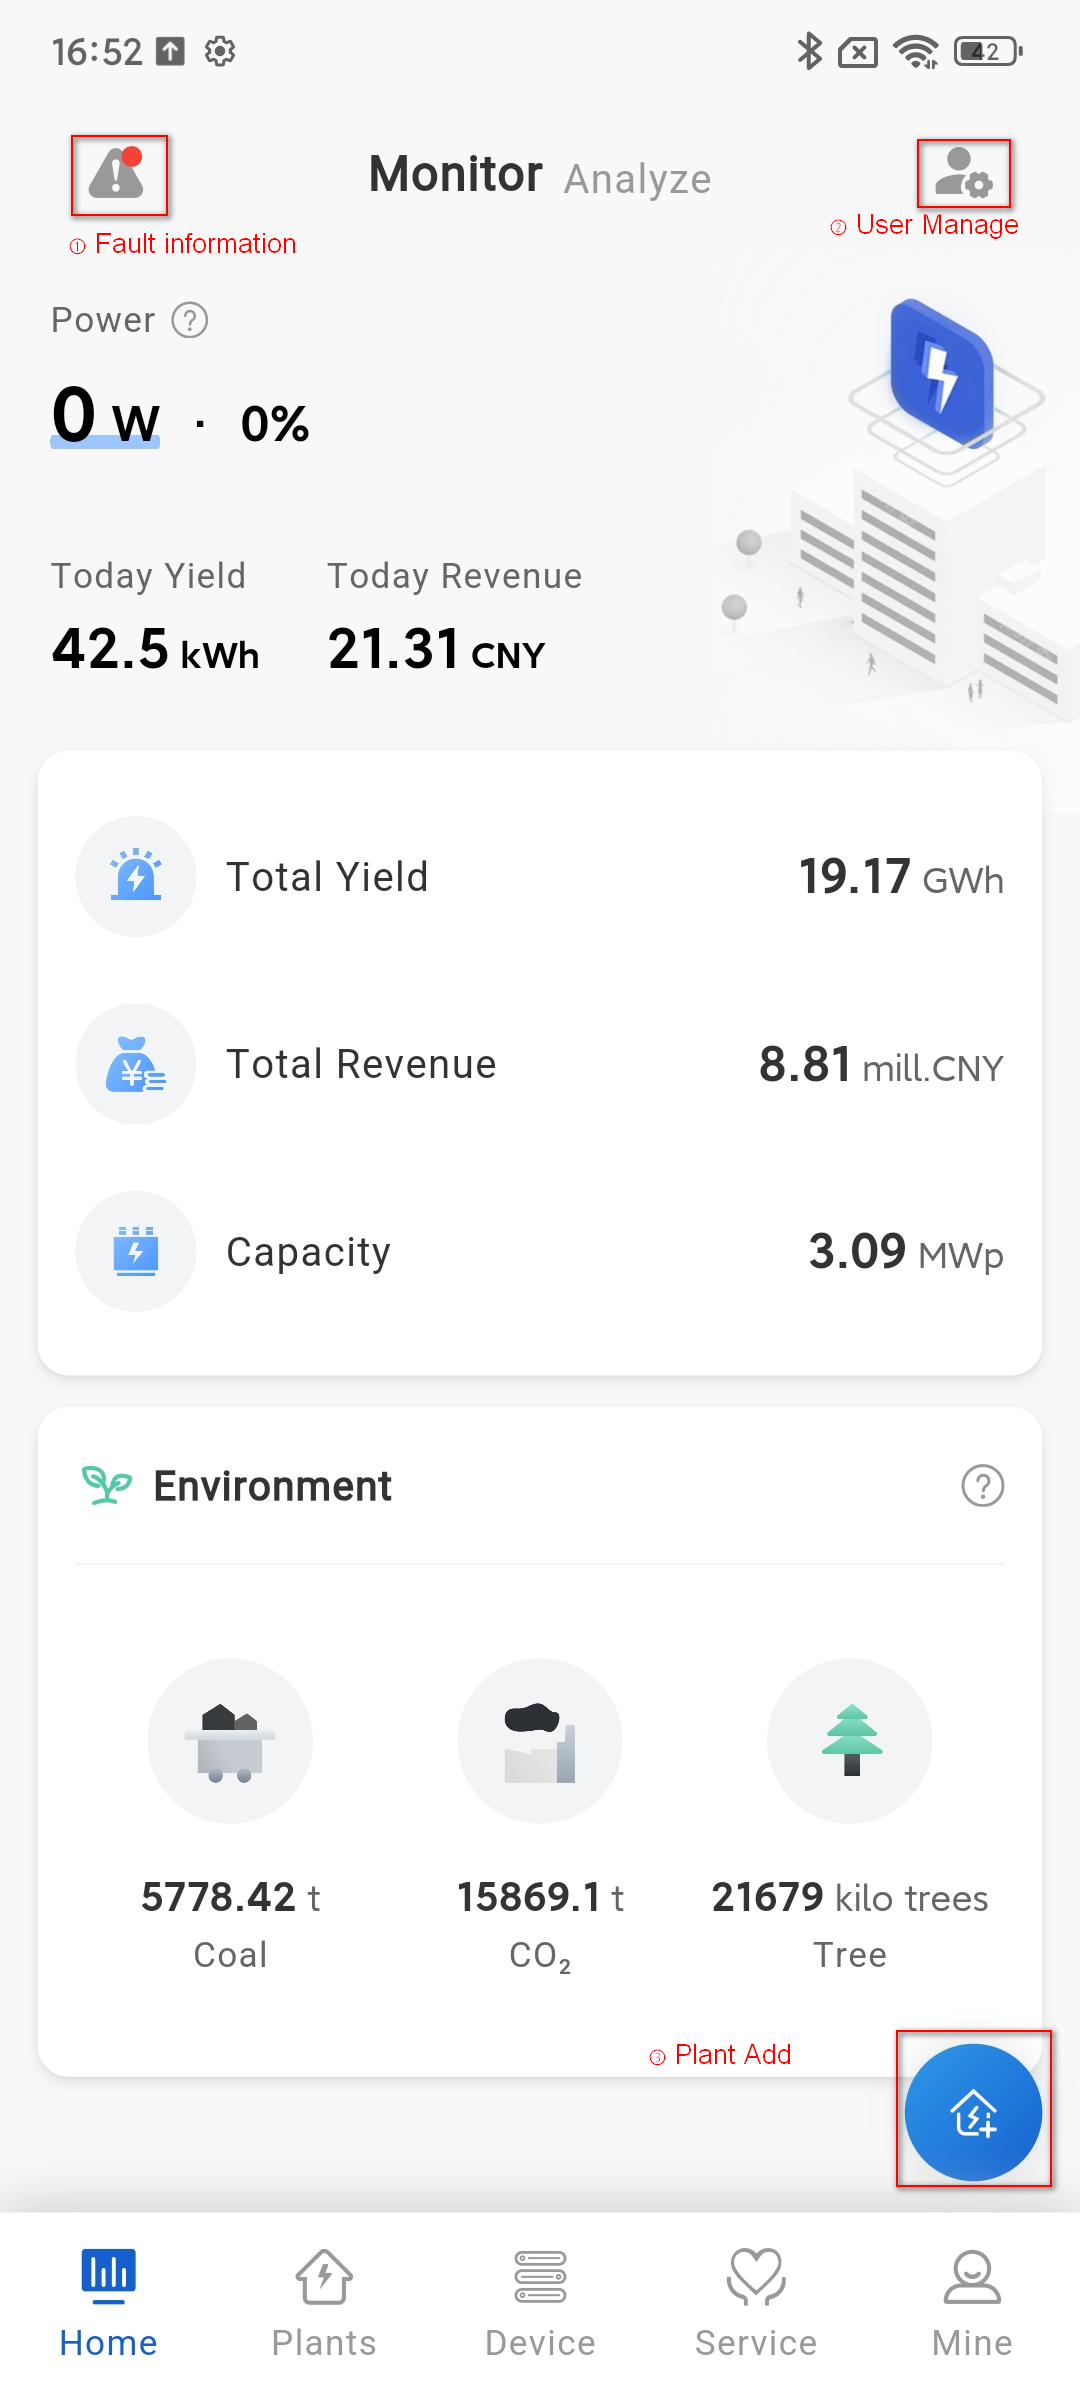
# Plant Add
Click the  button in the bottom right corner of the homepage to quickly enter the create Plant page. Please refer to the specific steps for operationPlant Add。